
PayPal stock price has come under intense pressure as investors exited technology stocks. The shares plunged to a low of $75.15, which was the lowest level since November 4. It has retreated by more than 76% from its highest point on record, giving it a market cap of over $85 billion.
A fallen angel
PayPal Holdings has gone full circle and emerged from being one of the top blue-chip fintech companies into a fallen angel. While its market cap of $85 billion is still high, it pales its all-time high of over $300 billion.
Analysts have fallen out of favor of PayPal. In November, most analysts, including those from BMO, Barclays, Wells Fargo, Goldman Sachs, and Morgan Stanley, downgraded their views on the company. Still, most of them have a favorable view of the company and expect it to rise to above $100 in the coming months.
PayPal stock price crash continued after the company lowered its forward guidance. Its revenue for the quarter rose by 10.8% to $6.85 billion in the quarter as its total payment volume surged to $337 billion. The company’s total transaction per active account rose by 13% to 50.1.
In total, the company’s net active account additions were 2.9 million. Total active customers rose to more than 432 million.
Therefore, PayPal stock price has plunged as investors started pricing it as a value company instead of growth. Historically, the company was being valued as a growth stock. Still, even as a value stock, the company is a good investment.
For one, it has a large user-base that it can monetize well over the years. It also has a substantial market share in the Buy Now Pay Later industry that is now dominated by the likes of Affirm and Block. The company also has a strong balance sheet, with over $10 billion in cash and an equal amount of long-term debt.
PayPal stock price forecast
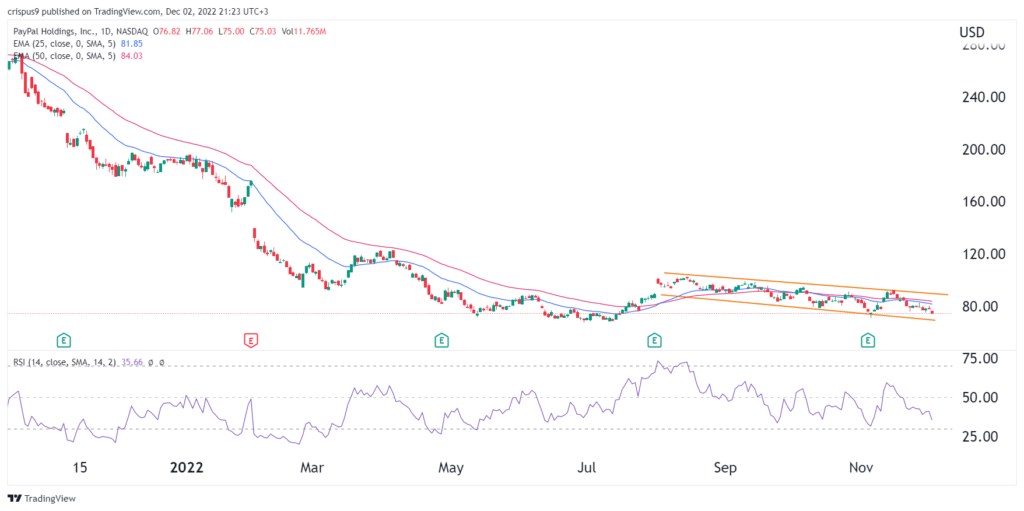
The daily chart shows that the PYPL share price has been in a tight range in the past few weeks. In this period, the stock formed a small descending channel pattern that is shown in orange. It has moved below all moving averages while the Relative Strength Index (RSI) has moved below the neutral point.
A closer look shows that it has formed what looks like a falling widening channel pattern. Therefore, it will likely have a bullish breakout, as buyers target the key resistance at $100.