HSBC share price was among the worst-performing stocks on Monday amid contagion fears following the collapse of Silicon Valley Bank (SVB). UK’s FTSE 100 index slipped by more than 2% on the back of a steep decline in bank and energy stocks. The HSBA stock ended Monday’s trading session 4.13% lower at 568.1p, following a 4.59% plunge on Friday.
Catalyst Behind the Crash
HSBC share price was in the spotlight on Monday as SVB contagion woes spread in the markets. The collapse of the Silicon Valley Bank sent banks to their lowest levels in more than a year. Statistics by Eikon data show that banks fell 5.65%, their worst day since March 2022 when they crashed 6.66% on warnings that the Ukraine war would affect their asset quality.
Silicon Valley Bank (SVB) collapsed last Friday, igniting contagion fears outside the United States. SVB bank was hit hard in the previous year as tech stocks fell in value. This, teamed with the Fed’s plan to hike interest rates further to a higher level than anticipated, was among the catalysts behind the bank’s crash.
Silicon Valley Bank’s collapse on Friday recorded the second-largest bank failure in the history of the United States. At the time of its collapse, SVB was the 16th largest bank in the United States and the largest in Silicon Valley.
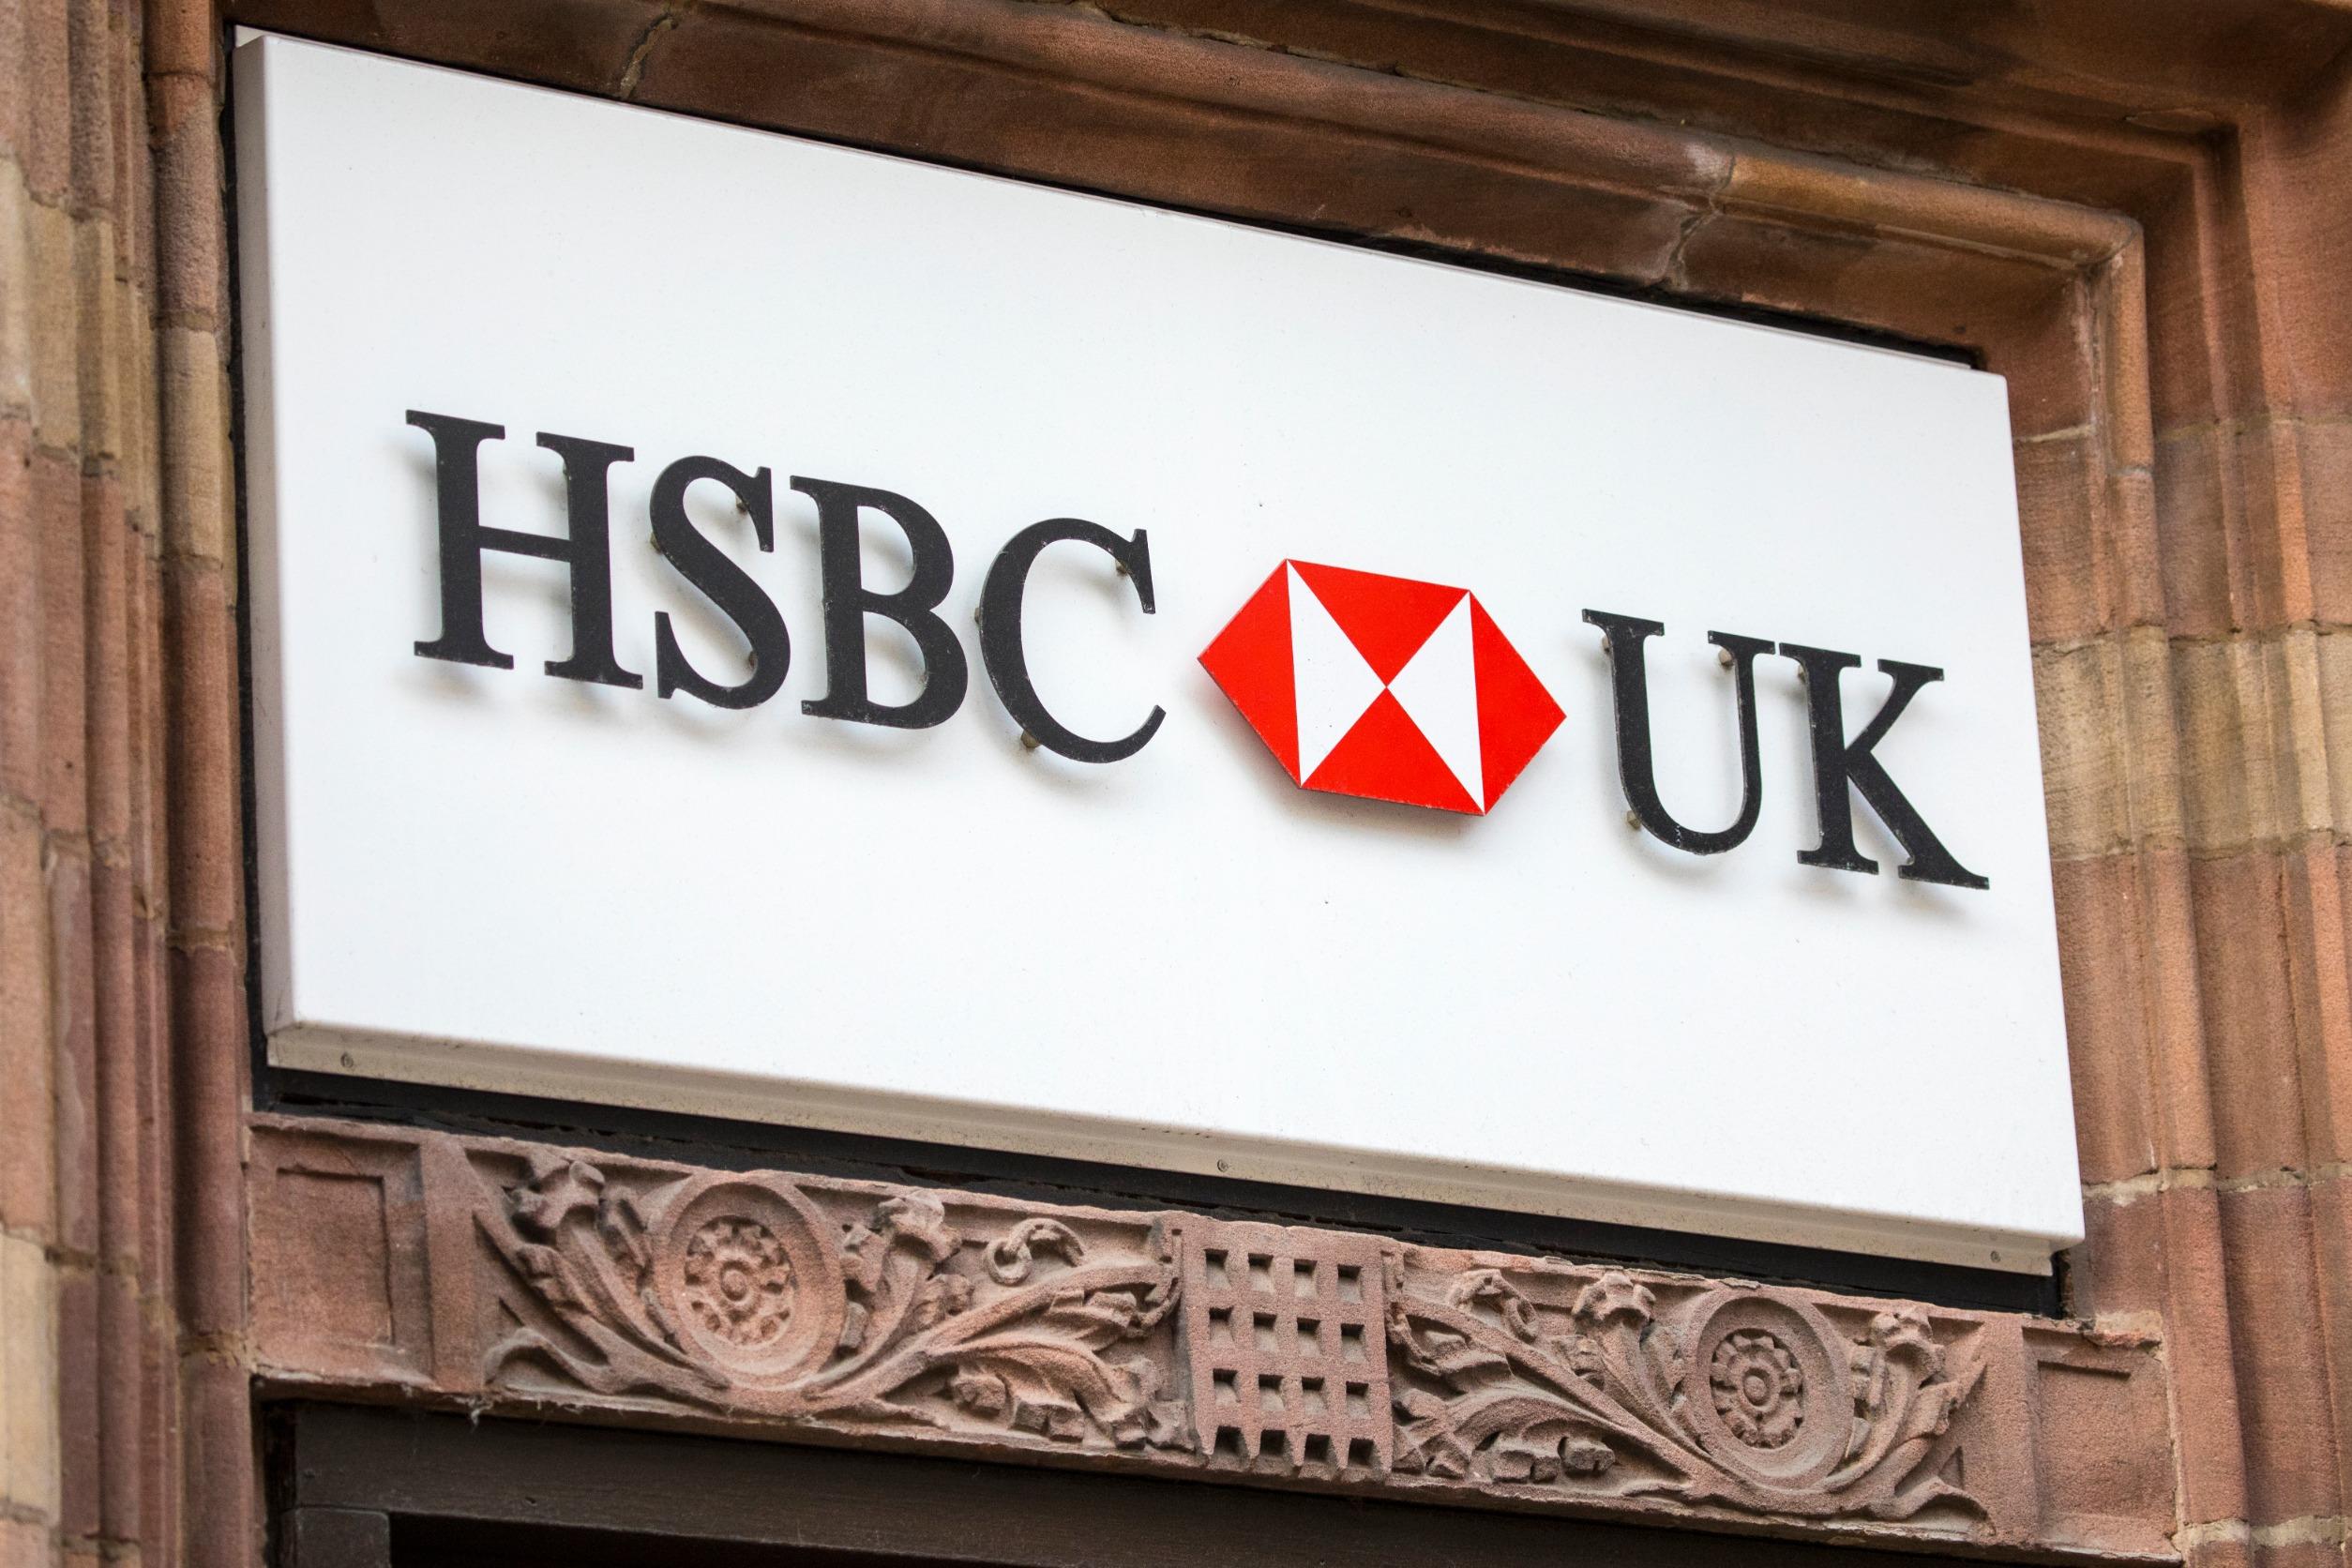
HSBC announced on Monday a deal to buy the UK subsidiary of the Silicon Valley Bank after all-night talks. Chancellor Jeremy Hunt announced the sale of the SVB’s UK arm by HSBC after the government and Bank of England (BoE) facilitated the private sale.
HSBC confirmed that it had agreed its UK subsidiary, HSBC UK, had agreed to buy SVB UK for £1 ($1.21) and would protect deposits. The assets and liabilities of SVB UK’s parent company are excluded from the transaction. HSBC’s move saw the company’s, as well as other bank’s shares, fall. Among the banks that plunged were Lloyds Banking Group, Barclays, Standard Chartered, and NatWest.
HSBC Share Price Outlook
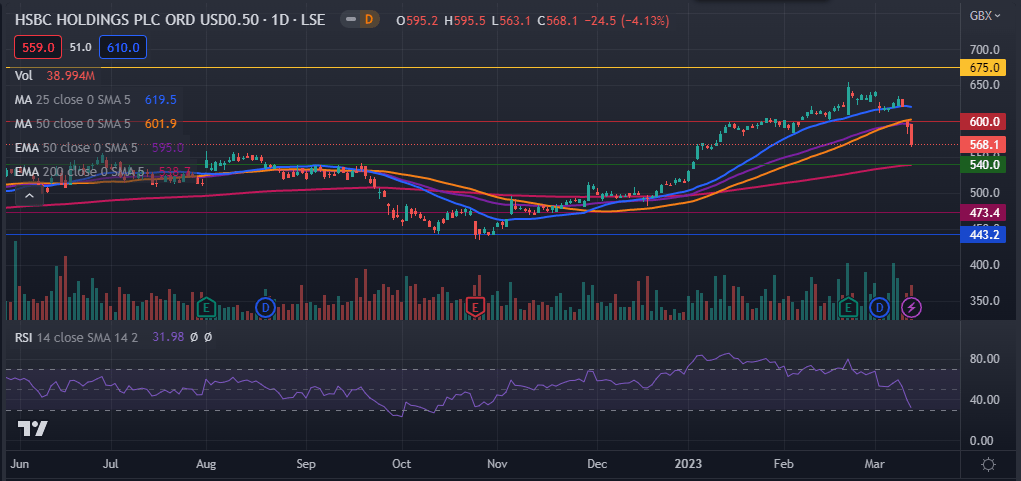
HSBC share price has been in the red for the past three consecutive trading sessions, adding to the 7.85% drop in the past week. On the daily chart, the HSBA stock has managed to move below the 25-day and 50-day moving averages. It is also moving below and above the 50-day and 200-day exponential moving averages, respectively. Its RSI is hovering 1 point above the oversold region, hinting at increased selling pressure.
As such, the stock is likely to drop to the next key support level at 540p in the short term before correcting its price. A move past the important resistance level at 600p will invalidate my bearish view.