
Solana price has been on a strong bearish run for the past few weeks as concerns about the cryptocurrency intensify. The altcoin has crashed more than 20% in the past month and 92.35% in price YTD. The coin’s total market cap has dropped by more than 4% in the past 24 hours while the total volume of the cryptocurrency traded has jumped 60%.
SOL’s Performance
Solana price has been under intense pressure for the past few months. Solana has been among the most affected cryptocurrencies by the bankrupt crypto exchange FTX. According to the Solana team, the Solana Foundation had $1 million in cash or equivalents on FTX before they ceased to process withdrawals.
The collapse of FTX saw the Solana price crash by more than 20% and is yet to recover. Solana currently ranks as the 16th most valued digital asset in the world. Its total market capitalization has plunged from $80 billion in November 2021 to less than $5 billion currently.
Earlier this year in August, the Solana blockchain was hacked as thousands of users complained of losing funds without their knowledge. This saw users lose funds worth more than $8 million. This year has proven to be highly volatile for cryptocurrencies.
Investors will be closely watching the US Consumer Price Index (CPI) data set to be released later Tuesday. Investors are positioned for a potentially stronger-than-expected CPI reading. A higher-than-expected inflation reading could prompt the Federal Reserve to be more hawkish.
Solana Price Analysis
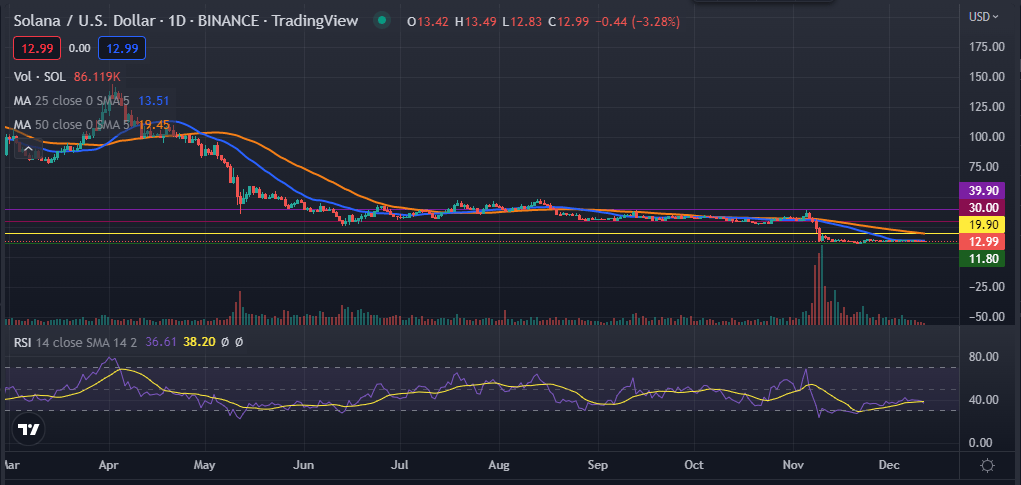
The daily chart shows that the Solana price has been under intense pressure for the past few months. At the time of writing, the altcoin was trading 3.28% lower at $12.99. It has managed to move below the 25-day and 50-day moving averages. Its Relative Strength Index (RSI) is at 38, which is 8 points closer to the oversold region.
Therefore, Solana price is likely to continue falling in the near term. If this happens, the next target support level will be $11.80. However, a flip above the 50-day moving average will invalidate this bearish analysis.