Gold price appears set to record its fourth consecutive month of losses with an environment of high interest rates and a strong US dollar being the key bearish drivers. Even so, its movements in recent sessions signals that it may have found its short-term bottom at the one-year low it hit a week ago at $1,681.16. Indeed, it has extended its previous gains in Thursday’s session as the market digests Jerome Powell’s comments following the Fed’s July interest rate decision.
What’s driving the market?
In a typical scenario, an environment of high interest rates exerts pressure on gold price while boosting the US dollar. However, the Fed interest rate decision released on Wednesday has boosted the precious metal; giving the bulls an opportunity to retest the critical level of $1,750 an ounce.
The observable improvement of the risk sentiment is largely founded on the Fed Chair’s acknowledgement that the aggressive tightening of the monetary policy may yield a slowdown in economic growth. While the central bank remains keen on fighting inflation, investors now expect the Fed to ease on the aggressive rate increases in coming months as it stays alert on the possibility of a recession.
Indeed, reported US GDP data has substantiated this forecast. The Commerce Department indicated that the US economy contracted in Q2’22 by 0.9% YoY. Analysts had expected it to rebound by 0.5%. This is the second consecutive quarter that the economy has contracted; which fits the standard definition of a recession. Notably, gold is a conventional safe haven during such times of economic turmoil.
Gold price technical analysis
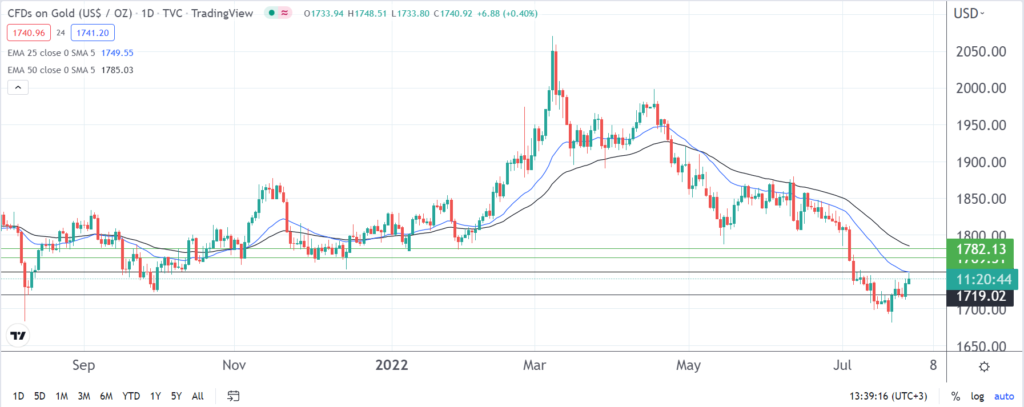
As seen on a daily chart, gold price is still below the 25 and 50-day exponential moving averages even after edging higher in Thursday’s session. Based on both the fundamentals and technicals, the precious metal will likely remain above the psychological level of 1,700 in the short term following the easing of the greenback’s rallying.
In the immediate term, the critical level of 1,750, which is along the 25-day EMA, is the main resistance level. If the bulls gather enough momentum to break past that zone, 1,769.51 and the upper level of 1,782.13 will be resistance levels worth watching. On the flip side, a pullback may have gold price find support at 1,719.02.